3 Ways Data Can Drive Effective Disaster Giving
Every day we use data to make better choices. We check the weather to plan our day. We compare stock price reports to determine how to invest foundation assets. We read endless reviews to decide what movies to watch or books to buy. We rely on data to make informed decisions, big and small.
Yet when it comes to disaster grantmaking—decisions that literally have life or death consequences—we often base our responses solely on news coverage, assumptions, or intuition.
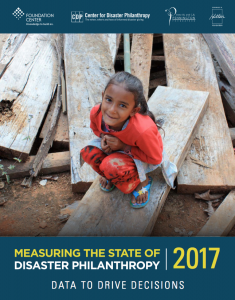 For data about what to do before, during, and after disasters, there’s no better source than the annual Measuring the State of Disaster Philanthropy (SODP). Today Foundation Center and CDP launched the 2017 report, a vital data project that would not be possible without the vision of CDP Board Chair Lori J. Bertman and the extraordinary support of the Irene W. and C.B. Pennington Foundation.
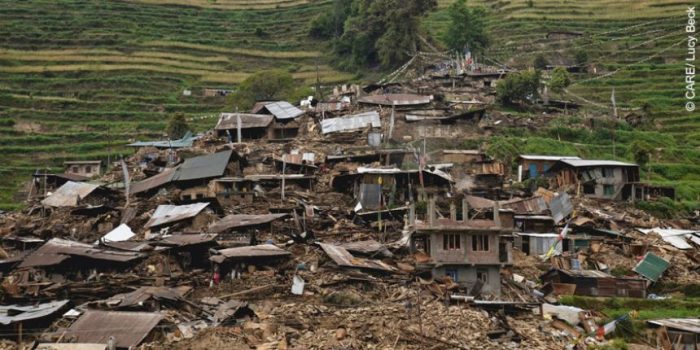
To illustrate how to use the SODP to make your disaster-related giving more effective, I look at the 2015 Nepal earthquake response.
Understand the big picture. Before committing any funds, review the SODP data to gain context and perspective on the state of disaster giving in general. Gain insights into the current environment by researching the following questions: Which organizations are giving to disasters? What types of activities are they supporting? Who are the nonprofit organizations receiving grants? And what kind of services are they providing?
Once you understand the bigger disaster picture, you will have a better handle on how you can advance your organization’s values and mission through strategic disaster philanthropy.
Discover funding gaps and imbalances. Over the last three reports we have found philanthropic support is typically given soon after the disaster occurs and for immediate response and relief. A far smaller share is designated for recovery and rebuilding, despite the fact it can take many years to recover.
For example, the Nepal data identified $67.5 million in philanthropic funds for the Nepal earthquake. Of that total, $56.2 million (83 percent) went toward response and relief strategies and less than $6 million (9 percent) went toward reconstruction and recovery, an activity still going on today. Your organization’s grantmaking could address the funding imbalance.
Explore new grantmaking ideas. Another common use of the report is to learn about other foundations’ innovative grantmaking. The SODP mapping platform makes it easy for you to drill down and see grant-level details.
For example, the Nepal earthquake giving data reveals that:
- The Aster DM Foundation, a foundation in the United Arab Emirates, provided a $393,860 grant to the Nepal Prime Minister’s Relief Fund to rebuild 500 houses in earthquake-stricken villages, including 23 homes of Aster employees.
- The Coca-Cola Foundation gave $200,000 to the United Nations Human Settlements Programme to support the repair and renovation of water-related and educational infrastructure at 20 schools.
Using more data to make disaster philanthropy decisions won’t make your job easier or faster. Many of your assumptions will be challenged and your processes expanded. But ultimately, you will make better grantmaking decisions, maximize the impact of your disaster philanthropy, and help build stronger, more resilient communities.

Robert G. Ottenhoff
More like this
Nepal Data Points to Need for Strategic Generosity