Updated Data Drives Best Practices in Disaster Giving
I look forward to the release of Measuring the State of Disaster Philanthropy: Data to Drive Decisions report every year. It represents a tremendous amount of work by many, including our partner, Foundation Center, our expert project advisory committee, and our own team here at CDP. This work would not be possible without the inspiration […]

I look forward to the release of Measuring the State of Disaster Philanthropy: Data to Drive Decisions report every year. It represents a tremendous amount of work by many, including our partner, Foundation Center, our expert project advisory committee, and our own team here at CDP. This work would not be possible without the inspiration of our board chair, Lori J. Bertman, and the support of the Irene W. and C.B. Pennington Foundation.
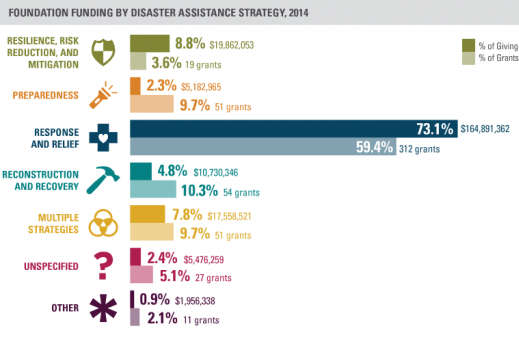
The report underpins our mission to transform disaster philanthropy with hard numbers. In our third year, the data continue to show an unbalanced focus on funding immediate response and relief efforts. We know from experience that the event-driven funding approach is unsustainable and hope this report motivates funders to support more strategic, long-term solutions.

Longitudinal Look at Disaster Giving?
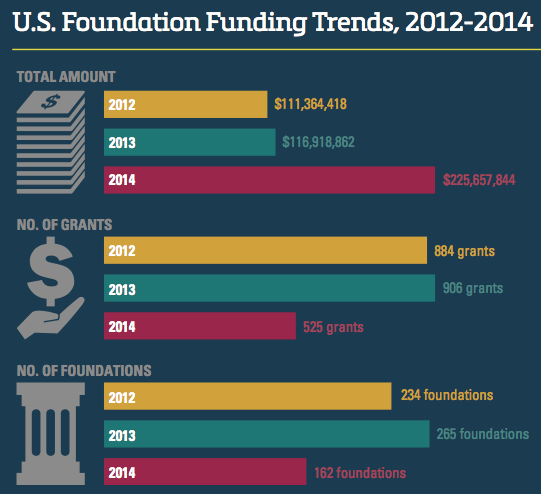
In our third year, I am particularly excited to have the longitudinal data that we have been hoping for. As we think about U.S. foundation funding trends from 2012 to 2014, here is what we know:
- Dollar amounts ranged considerably over the three years: $111 million in 2012, $117 million in 2013, and $226 million in 2014.
- The actual number of grants to disasters also varied: 884 in 2012, 906 in 2013, and a considerable decline in 2014 to 525 grants.
- The number of foundations peaked in 2013 and dipped considerably in 2014; 243 foundations awarded grants in 2012, 265 in 2013, and 162 in 2014.
The differences noted above in the data are aptly explained in the text of the report:
“The Ebola outbreak of 2014 generated sizable grants from specific funders: The huge increase in funding is largely due to grantmaking by the Bill & Melinda Gates Foundation and the Paul G. Allen Family Foundation. Outside of this crisis, 2014 was a below-average year in terms of frequency of natural disasters. Overall, fewer U.S. funders were engaged in disaster-focused grantmaking and far fewer grants were distributed.”
Moving Beyond Event-Driven Response
The United States and the Caribbean are still reeling from Hurricane Matthew’s deluge and devastation. This year has also been marked by flooding in Louisiana, West Virginia, and Texas. Community crises such as the Pulse Nightclub shooting and the truck massacre in Nice also characterize this year’s disasters. The Global Refugee Crisis continues to shock and sadden at every turn. These tragedies have been top of mind for many philanthropists, and certainly for the professional humanitarian community.
And yet, for the philanthropic community to be as strategic as it possibly can, we need to move away from event-driven reactions and instead focus on the ecosystems and contexts that can mitigate against known and unknown disasters.
The data and analysis found in the Measuring the State of Disaster Philanthropy report give us insights into how funders prepare for and respond to disasters; in what manner (gifts in kind, cash, or services in kind); to which responding organizations (large international NGO or local NGO); and for what programmatic purpose. Through the report and the online dashboard, we can see what strategies philanthropy employs to support disasters; where dollars are deployed geographically; and for what kinds of disasters. The numbers clearly indicate that donors must not choose the easiest way to support disasters, but rather, the best way support disasters.
Explore the full State of Disaster Philanthropy report, interactive map, and dashboard with complex search functions.
Join CDP president & CEO, Bob Ottenhoff and Foundation Center Vice President for Knowledge Services, Larry McGill Thursday, November 17, for the State of Disaster Philanthropy webinar on key findings and a demonstration of the interactive dashboard and mapping platform.
More like this

Good News, Disturbing News from State of Disaster Philanthropy

