A decade of measuring the state of disaster philanthropy

When I joined CDP in 2018, one of my first projects was to manage our role in a joint initiative between CDP and Candid (then Foundation Center) called “Measuring the State of Disaster Philanthropy: Data to Drive Decisions” (or SODP for short). This project was, and remains, the only aggregated tracking of disaster giving by philanthropic institutions in the U.S.
Back then, CDP was eight years old. We were in year six of the partnership with Candid, and we were releasing the fifth iteration of the SODP report. We were already learning a lot, adapting to trends and garnering interesting results.
Now, with another five years under our belts – including a worldwide pandemic, that learning has continued, and we have grown alongside the disaster philanthropy field. In December, we released the 10th SODP report as an infographic.
The most fascinating statistic
Math and I don’t get along. I almost flunked out of grade 11 math, and my mandatory statistics class in university was a nightmare on the math side. But for some reason, I’m good at spotting trends in numbers and stats. As I looked through 10 years of SODP data, I realized that the 2023 report – which examined 2021 disasters – was telling an interesting story: When looking at non-epidemic funding, it rivaled our biggest year of disaster giving.
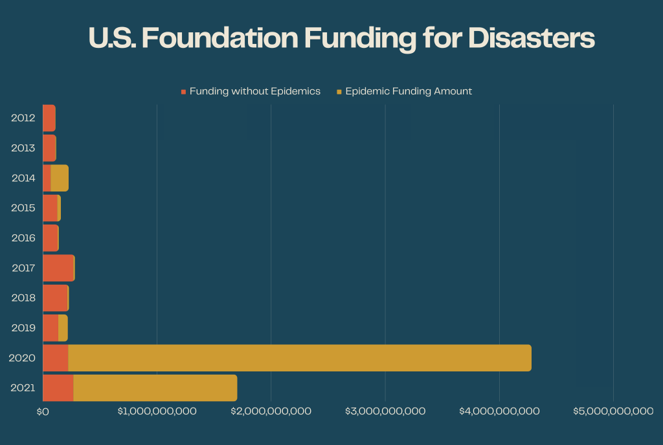
Separating epidemic funding (shown in gold below) from the total revealed that even in the COVID-19 or other big epidemic years, the funders in Candid’s Foundation 1000 data set* still contributed significantly to other disasters (shown in orange). Some years were higher than others, but non-epidemic disaster grantmaking averaged $163.9 million annually (ranging from $67.6 million in 2014 to $266.4 million in 2017).
2021 was the second-highest year, with $266.2 million in non-epidemic funding. This is only about $236,000 less than in 2017 when three major hurricanes – Harvey, Irma and Maria – hit the U.S. In 2020, a record year for overall funding, non-epidemic spending by these donors was $220.7 million, the third highest in the 10-year period.

*Candid’s Foundation 1000 data set tracks grants over $10,000 given by 1,000 of the country’s largest community and private foundations. These funders spend 50-60% of grant dollars, despite representing only 1% of all funders in the U.S.
What has the data shown over the 10 years?
The first SODP report focused only on the Foundation 1000 and tracked 884 grants totaling $111 million. The majority (58%) of this funding went to “natural disasters*.” Almost half (48%) of the funding was for response and relief efforts. Human services was the top-funded issue area (62% of funding).
The 2023 report tracked 32,186 grants totaling nearly $3 billion. Response and relief again dominated, with 82.4% of funding directed that way. Health was the top-funded issue area, followed by human services. Looking just at the Top 1000 funders, we see that 438 funders made 7,202 grants totaling just over $1.7 billion.
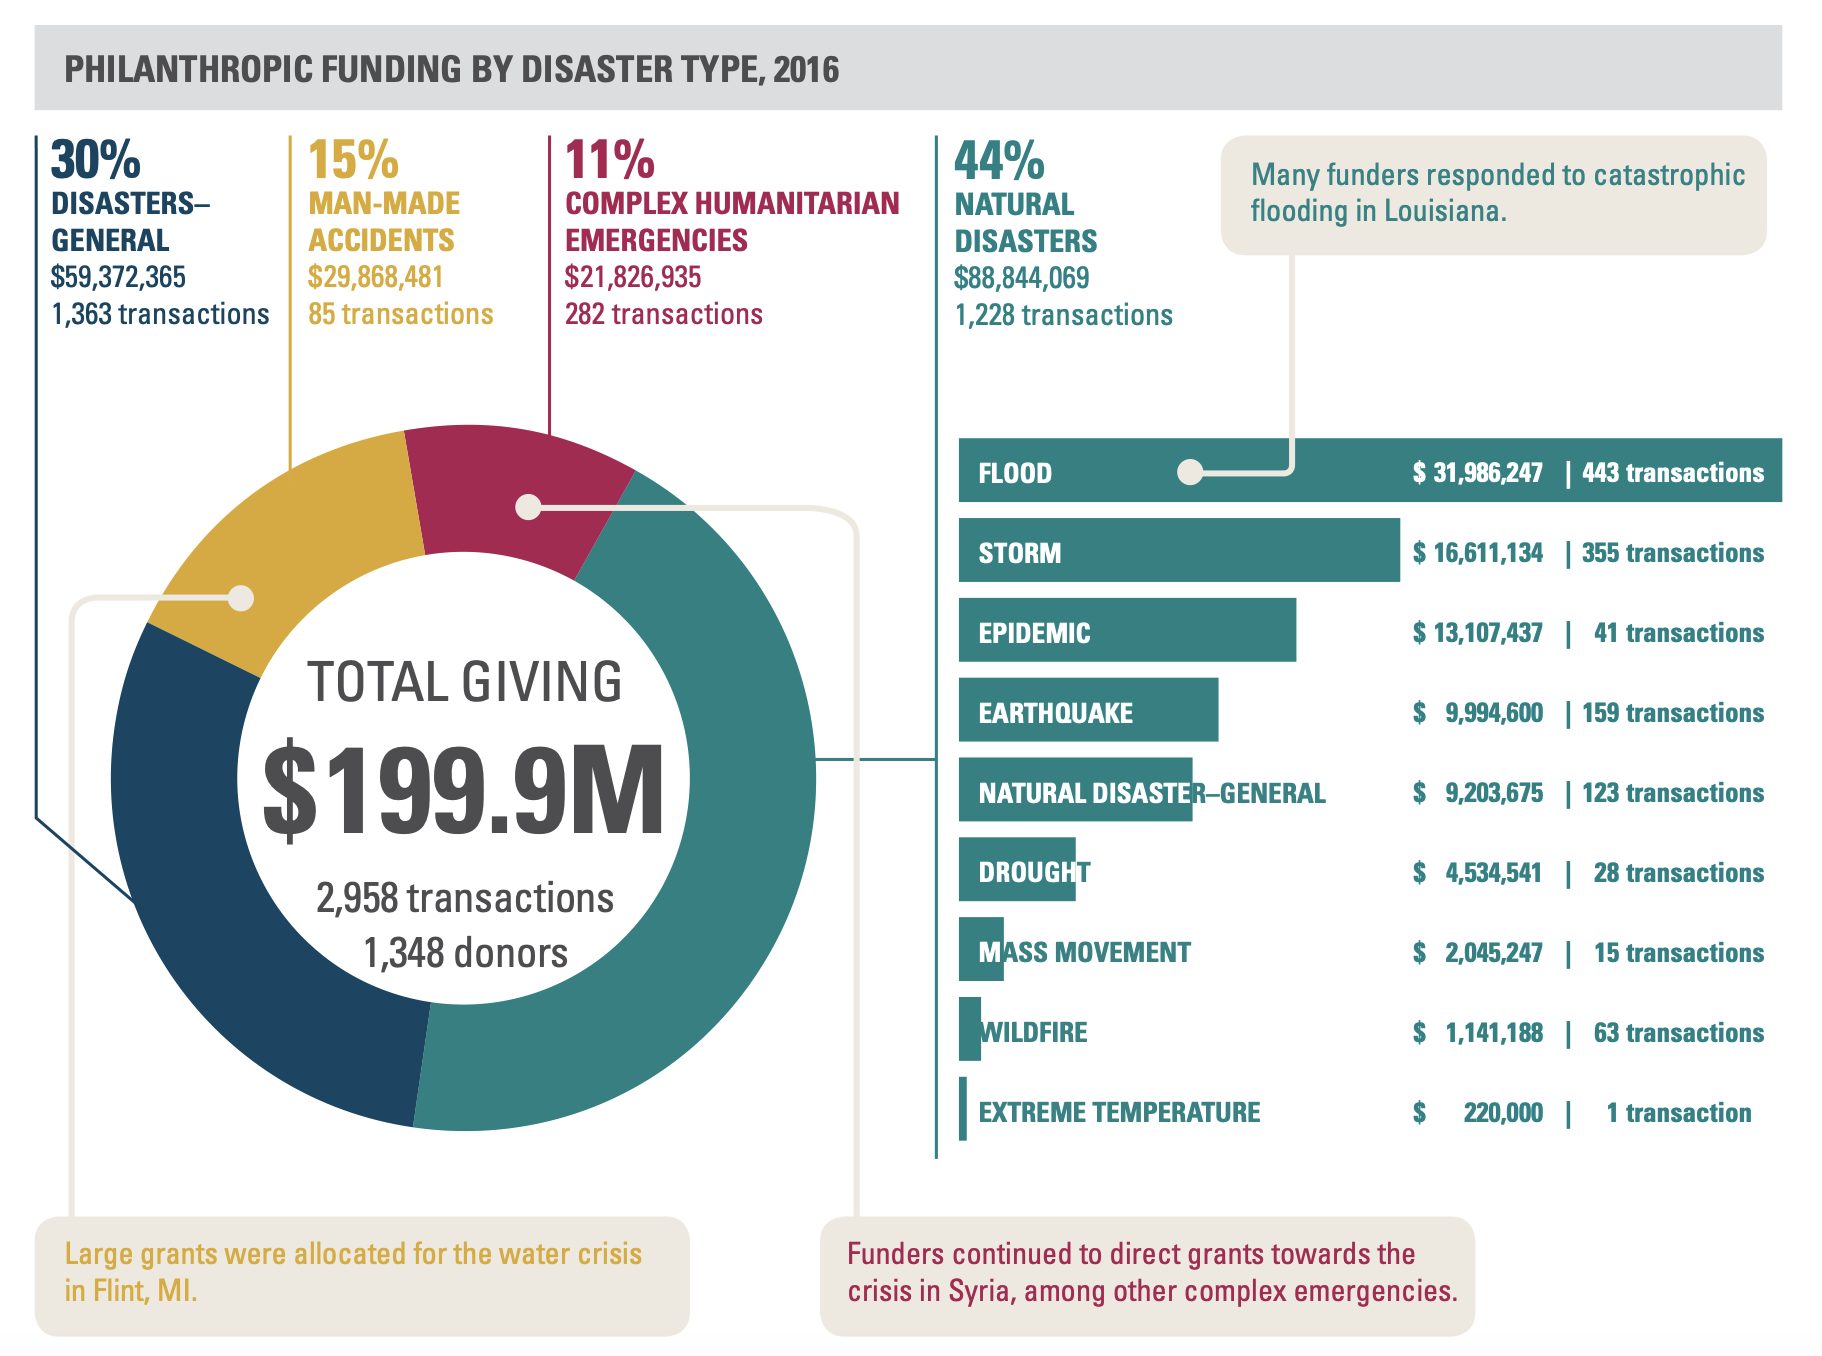
Natural hazards and severe weather events were the top-funded disaster category every year. Within that, epidemics were the top funded events in five reports (2023, 2022, 2021, 2017 and 2016), storms were the leading category in four reports (2014, 2015, 2019 and 2020), and floods topped the list in 2018 (due to the 2016 floods in Louisiana). See the chart below for an example of philanthropic funding by disaster type.

*In 2021, CDP and Candid stopped using the phrase “natural disasters” to recognize that disasters are not natural. Instead, disasters are the result of a natural hazard or severe weather event impacting an at-risk population.
Response and relief versus reconstruction and recovery
Looking at all giving over 10 years, it’s clear that the response and relief category has always dominated disaster assistance strategies, ranging from 34% to 90% of funds given. The reconstruction and recovery category has consistently been second, with amounts ranging from 2% to 18.7%.
While I have listed all 10 years in the chart below, it is important to note that the first five years of data included only the Top 1000 largest U.S. donors, while the reports examining 2017 and beyond included other donors. The trends remained relatively consistent, even if it is hard to compare dollar amounts. For example, both 2014 and 2021 saw 4.8% of funding go to reconstruction and recovery, but there was a difference of more than $131 million in actual dollars given.
| Disaster Year | Response and Relief % | Response and Relief Total Dollars | Reconstruction and Recovery % | Reconstruction and Recovery Total Dollars | Total disaster giving |
|---|---|---|---|---|---|
| 2012 | 46.2 | $51,496,838 | 11.3 | $12,581,571 | $111,364,418 |
| 2013 | 42.3 | $49,419,709 | 18.7 | $21,855,522 | $116,918,862 |
| 2014 | 73.1 | $164,891,362 | 4.8 | $10,730,346 | $225,657,844 |
| 2015 | 34 | $53,617,635 | 5 | $7,190,775 | $158,100,000 |
| 2016 | 42.3 | $84,388,623 | 17 | $33,149, 486 | $199,900,000 |
| 2017 | 64 | $323,771,093 | 17 | $83,314, 626 | $504,000,000 |
| 2018 | 50 | $232,506,611 | 12 | $57,528,344 | $468,000,000 |
| 2019 | 51 | $180,265,802 | 6 | $20,978,456 | $352,000,000 |
| 2020 | 90 | $4,681,355,805 | 2 | $119,033,388 | $5,200,000,000 |
| 2021 | 82.4 | $2,453,782,439 | 4.8 | $141,875,041 | $2,976,979,112 |
| 2012 to 2021 average | 57.53 | $827,549,592 | 9.88 | $48,971,680 | $1,031,292,024 |
Key messages over 10 years
The messages from that first report in 2014 echo those that CDP continues to share:
- Funding is needed beyond immediate relief, and there is a shortfall in recovery dollars.
- Building community resiliency and preparedness can substantially mitigate the impact of disasters.
- Media coverage influences giving, both by individuals and philanthropic entities.
- When funders work together and effectively pursue collaborative efforts, they can minimize duplication of effort and improve their ability to identify and address “underfunded” disasters.
- Recognizing the importance of including local residents in their own recovery helps solve issues faster.
These are all things I and other CDP team members have highlighted in other reports and blog posts throughout the years.
CDP now also recommends multi-year, general operating dollars whenever possible and recognizes the critical importance of embedding racial and intersectional equity into everything we do.
Final thoughts
Our infographic didn’t include recommendations this year; we let the data speak for itself. I wrote some initial analysis in my first SODP blog post, but after looking at the 10 years of data, here are a few more:
- Eliminate “natural disasters” from your lexicon (including on your website and forms). While the phrase “natural hazards and severe weather events” is a mouthful, it is more accurate. Disasters are socially constructed. You can also just say “natural hazards,” “environmental disasters” or even just “disasters.” Speak up when you hear others use the phrase. I’m on a personal mission to get my FEMA friends to stop saying it as often.
- Share your data with Candid. Better data collection improves tracking and can help funders make more informed decisions. We found that revising our grant descriptions to align with Candid’s reporting made our public summaries of grants easier to understand and, even more importantly, decreased the time our finance department spends filling in 990s.
- Continue to give and give more. Our 2023 report showed a slight increase in non-epidemic disaster giving. We hope this trend remains, if only because we saw several major disasters in 2022 and 2023. As the climate crisis worsens, disasters will continue to increase. We need all funders to step up to help support communities.
- Move more money into recovery. There are significant needs in the immediate aftermath of a disaster, but there are also needs down the road. It’s hard for responding organizations to raise money years after a hurricane has hit, even when the needs of their community remain. Designate a percentage of your funding to support recovery.
Check out the full Measuring the State of Disaster Philanthropy 2023 infographic to learn more about 2021 disaster giving, and read all the previous SODP reports here.
