Making sense of the numbers: Measuring the State of Disaster Philanthropy 2023
What if I were to tell you disaster philanthropy was only 2% of all philanthropic giving in 2021? Would you be concerned? I was when I first read that statistic. But then I learned that 2% represented $3 billion, one of the highest amounts tracked since 2012, which gives me hope. Statistics don’t always tell the whole story, which is why CDP works to make information clear for our funder audience.
CDP is proud to release its 10th annual Measuring the State of Disaster Philanthropy (SODP) research. Supported by Candid’s data and research team, we examined how philanthropy has funded disasters to answer critical questions. What types of disasters are funded? What strategies do they use? What kind of activities get funded?
Key findings
Since 2020 was such a phenomenal year of disaster giving due to the COVID-19 pandemic, I was worried about what kind of decrease we would see in 2021. CDP’s previous report, “Philanthropy and COVID-19: Examining two years of giving,” made me optimistic that funding might remain high, but pledges do not always convert to dollars out the door.
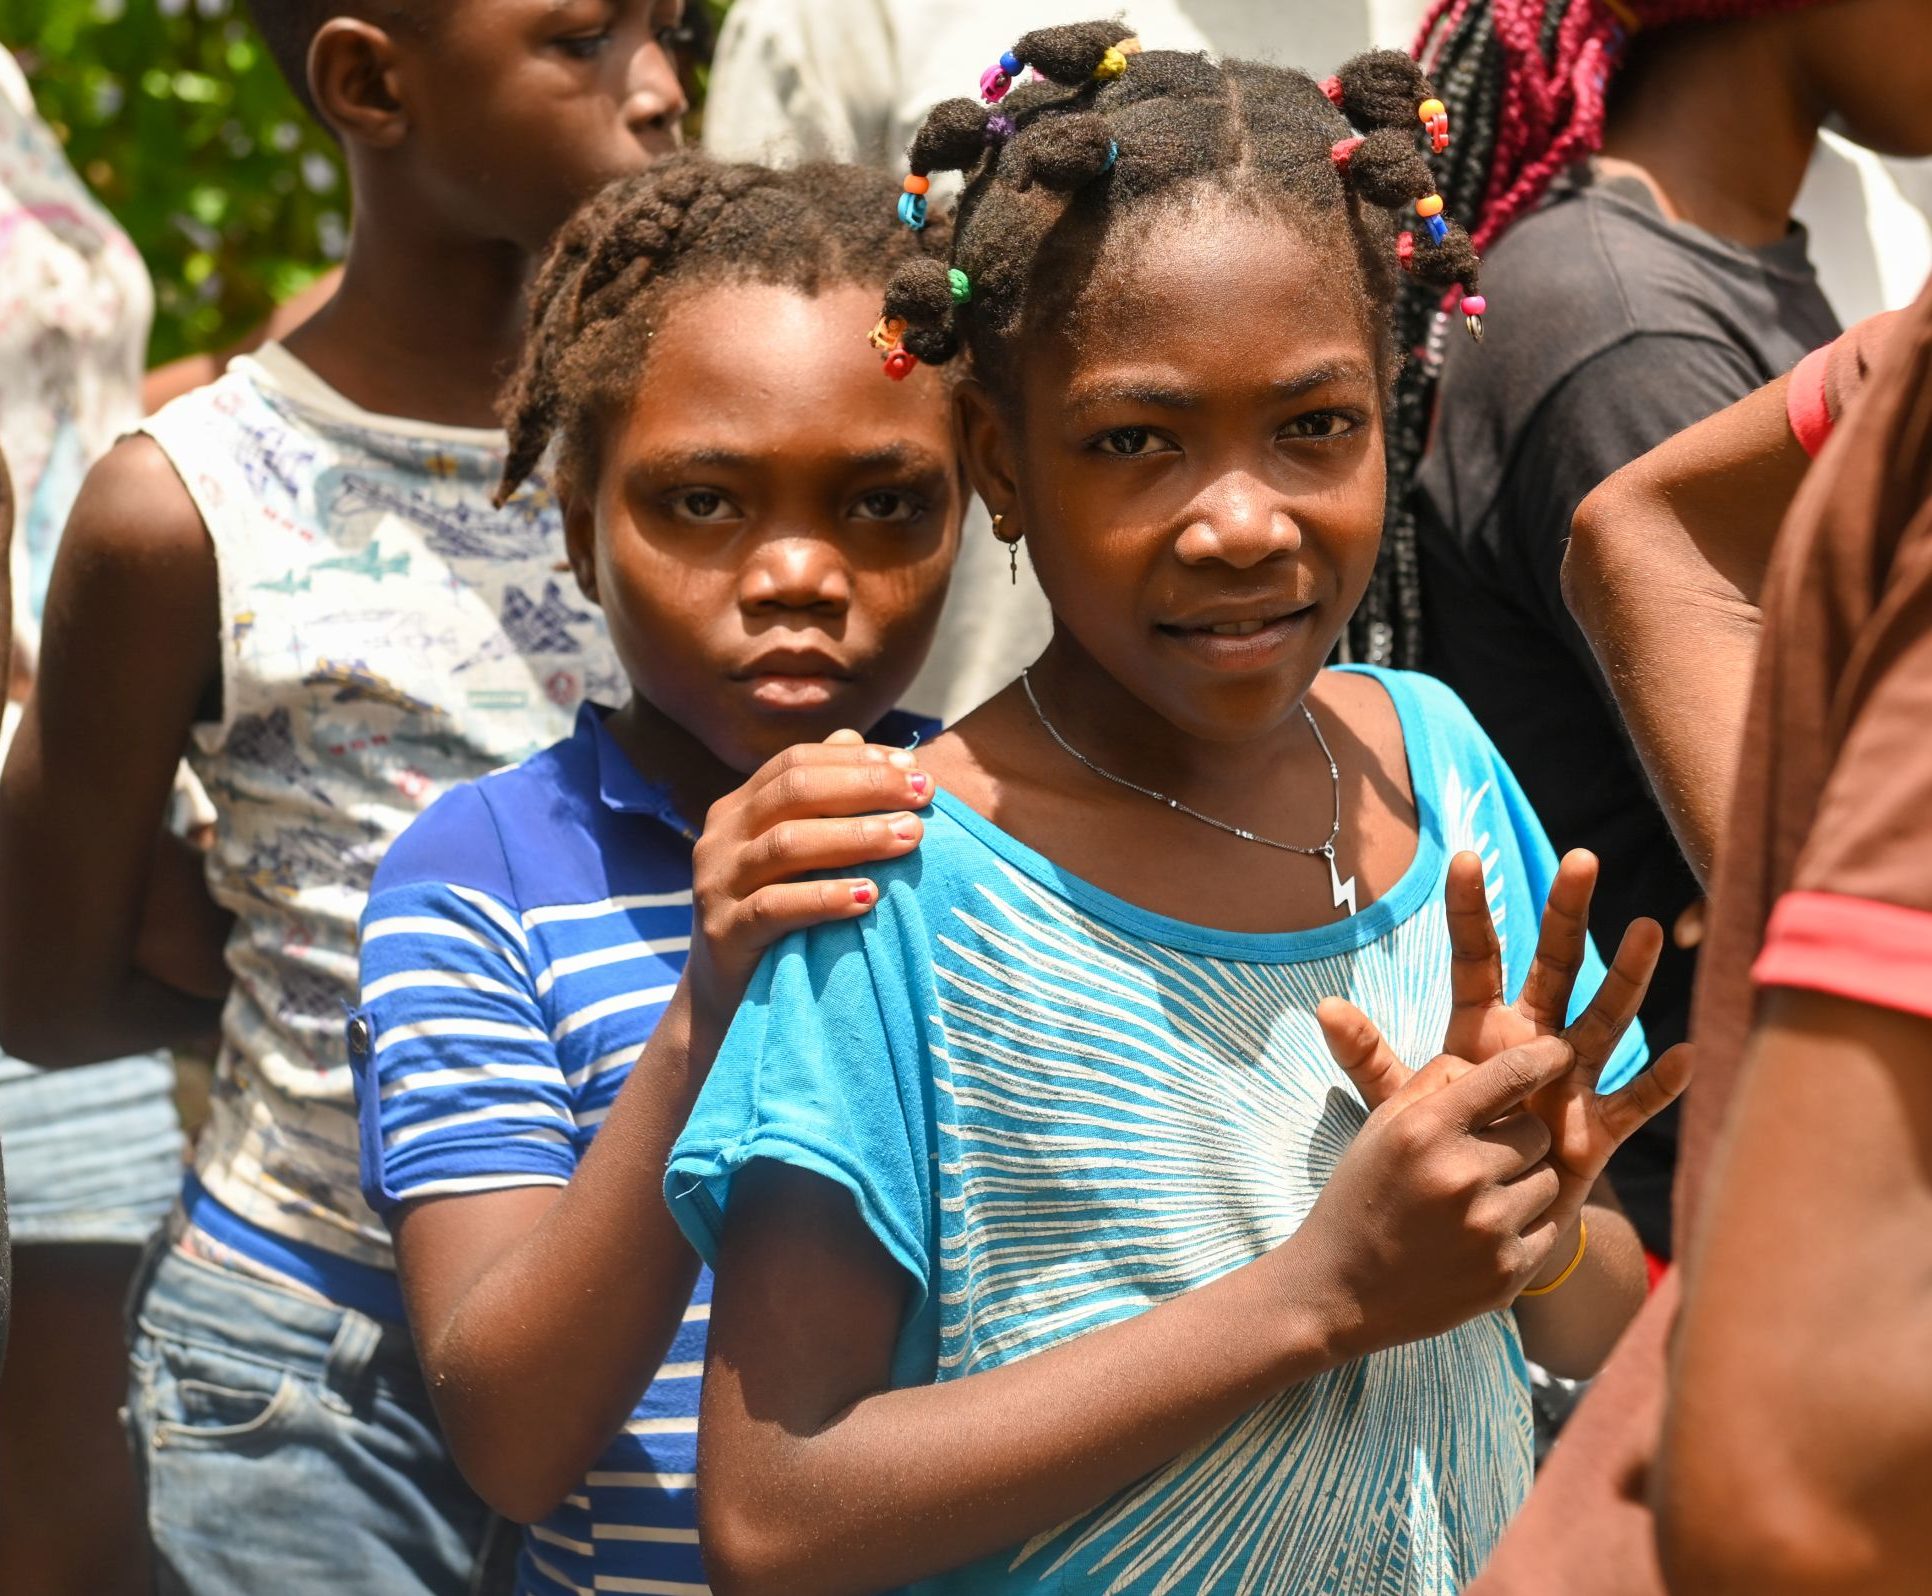
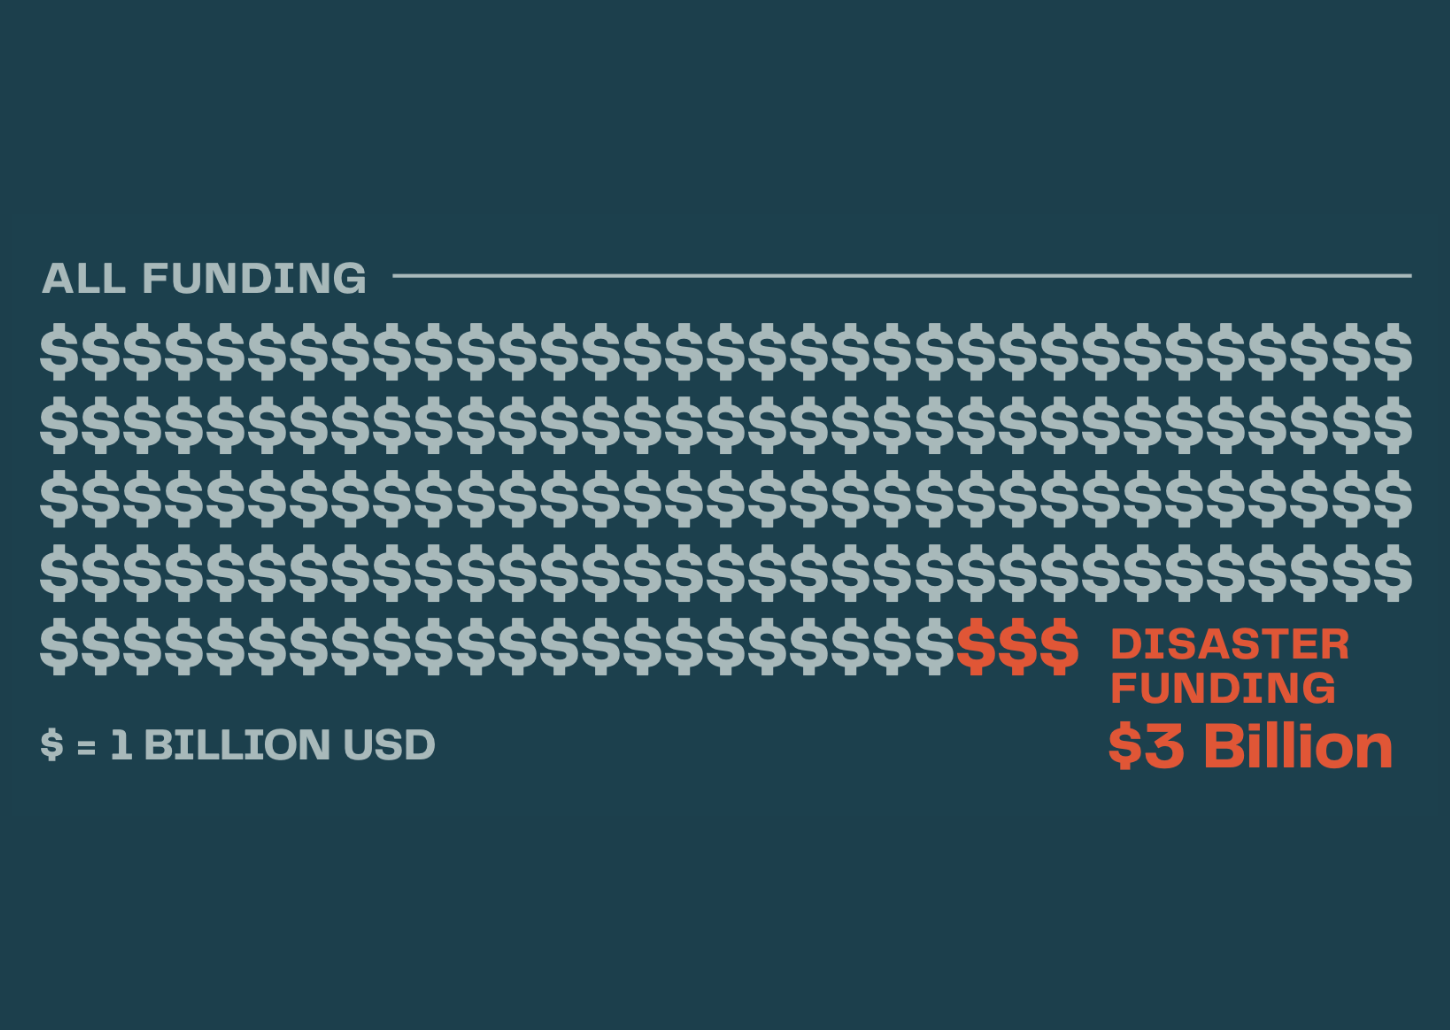 There was $3 billion in disaster giving by private and community foundations, corporations, and public charities in response to 2021’s disasters, including flooding in many parts of the world, Hurricane Ida, winter storms in Texas, the Haiti earthquake and Typhoon Rai in the Philippines.
Unsurprisingly, the epidemic category was the highest disaster type at 82%. Natural hazards and severe weather events made up 6% with over $169 million in funding. Unusually, man-made accidents saw 3.1% of funding, primarily due to a $92.4 million grant from the Marine Preservation Association (MPA) to Marine Spill Response Corporation for oil spill response.
I was pleased to see that even though funding decreased from 2020’s impressive giving total, 2021’s $3 billion is still significant. After several years of disaster giving totals that only once even reached the half-billion-dollar mark, these numbers are impressive. For this, my colleagues and I are grateful to our general operating funders, including Bohemian Foundation, Google.org, eBay Foundation, Margaret A. Cargill Philanthropies, PayPal and UKG. They help CDP inform funders and spread the message that disasters aren’t short events and recovery takes years. I hope future giving will continue to reflect this positive trend.
Year-over-year trends
It’s hard for us to directly compare total year-over-year giving, as Candid’s grants database at the start of SODP was only based on grants from 1,000 large U.S. foundations. But, as they incorporated more advanced tools, allowing them to process and code much more data, the data set grew to include grants from most U.S. public and private foundations, non-U.S. donors, large individual donors, etc.
Data from Candid’s Foundation 1000 does offer a snapshot of year-over-year trends. To address challenges in data collection, “Candid created an annual research set, the Foundation 1000, which captures grants of $10,000 or more awarded by a set of the 1,000 largest U.S. funders for a given year. Grants in this set undergo additional cleaning and review to ensure an acceptable level of completeness and coding accuracy.”
This data shows that disaster giving by the 1000 largest U.S. foundations has been impressive over the past several years and exceeded $1.7 billion in 2021. Next month, we’ll examine how Foundation 1000’s giving has changed over the 10-year period.
Immediate response and relief continue to get the bulk of disaster funding
So where does this money go? Unfortunately, despite a large amount of disaster giving, 2021 continued a trend that has been present across all 10 years of the report: more money was invested in response and relief activities ($2.5 billion) than in all other areas.
In fact, for every $1 given to disasters, only 10¢ went towards resilience, risk reduction, preparedness, reconstruction and recovery efforts combined.
Despite disaster giving in 2021, the reconstruction and recovery category only saw $142 million in funding. Representing just 4.8% of funding, this is not enough to support the recovery from all disasters that year.
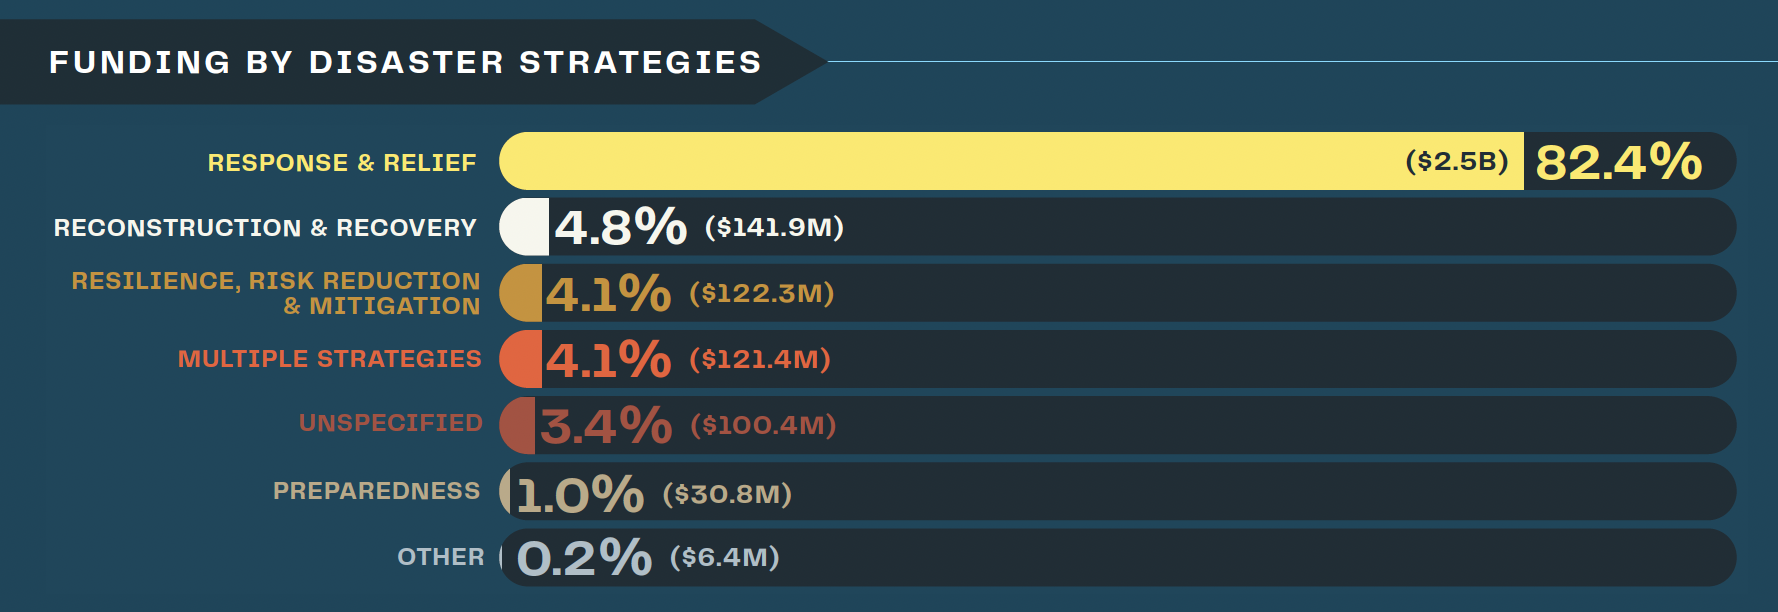 The preparedness category received only $31 million (1%) compared to resilience, risk reduction and mitigation, which brought in $123 million for 4.1% of the funds given.
In the coming years, the climate crisis will only worsen, so funders need to think about how they can reduce the long-term impacts of disasters and bring communities back faster and stronger after a disaster. This includes building upon the support given to response and relief to increase our focus on recovery. We know that recovery is a phase, not a timeline. Activities carried out immediately after a disaster can build a more robust and complete recovery, but additional funding is needed to help make communities whole.
Supporting populations
It has always been interesting to see what communities receive funds and what topic areas are prioritized. In 2021, children and youth received the most funding at 17% overall (19.2% in the U.S. only and 11.6% internationally only). Ethnic and racial groups received the second-highest amount at 13.3% (17% in the U.S. only and 3.9% internationally only).
When disasters occur, we know that previously marginalized, at-risk and oppressed communities take longer to recover and need more support. That is true with the pandemic and natural hazards. In blue sky times, donors can think about supporting and improving the circumstances of these communities to improve their ability to recover after the next disaster.
Funding by issue area
Another way to break down data is to look at the funding categories. In 2021, the largest amount of giving went to health ($608.8 million) and human services ($592.6 million).
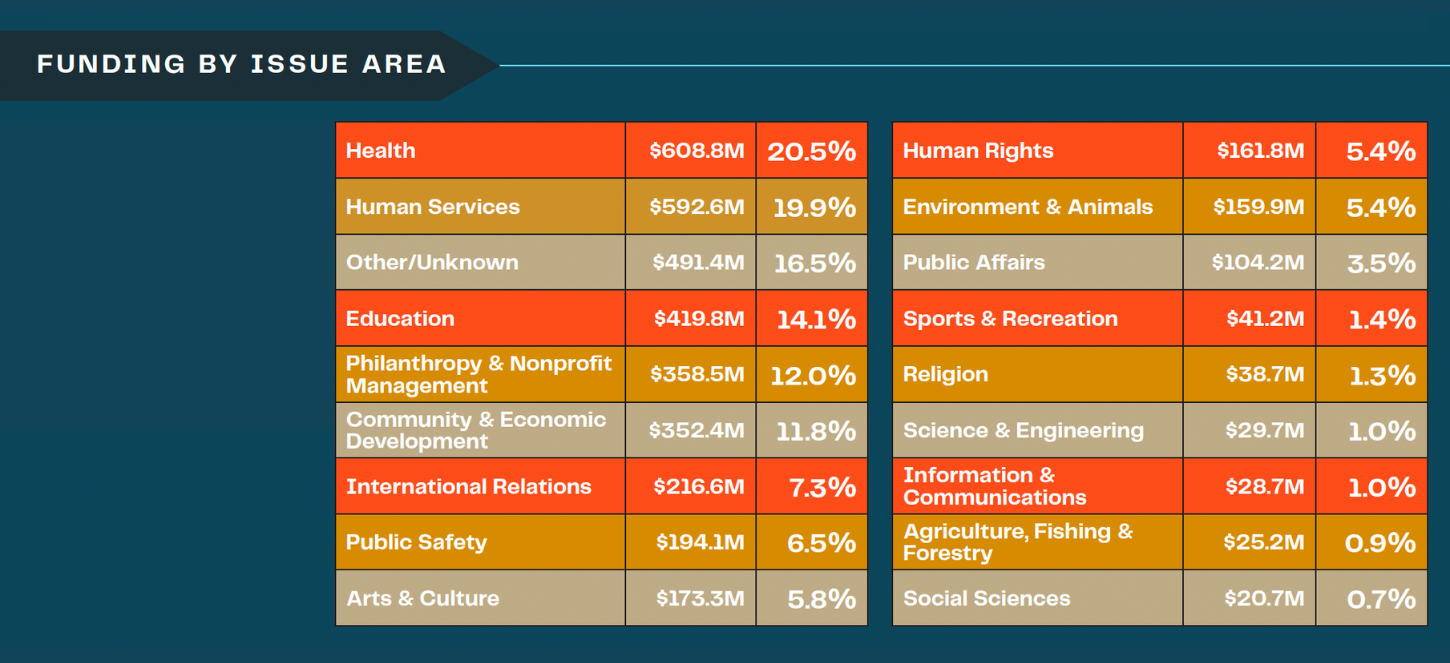 Other significant categories were education, philanthropy and nonprofit management, community and economic development, international relations, public safety, and arts and culture. This variety in funding focus shows how broadly the pandemic affected the whole community and supports CDP’s belief that all funders are disaster funders. Regardless of your area of focus, disasters will impact those you work to support.
Funders can help improve data collection for both funding by population group and issue area by being more explicit in the grant descriptions they put on their 990s. This helps Candid and CDP better track how funding is being used.
What funders can do now
Funders can help communities recover equitably after a disaster by:
- Continuing to increase overall disaster giving to help meet the immediate and long-term needs of disaster-affected communities. We are witnessing more devastation from humanitarian crises and natural hazards, including those fueled by climate change. For many affected communities, the road to recovery, especially for marginalized groups, is long and under-resourced.
- Addressing the root causes of disparities in their grantmaking. The impacts of the COVID-19 pandemic and other disasters last years and sometimes decades. They exacerbate underlying inequities, such as food and housing insecurity.
- Building relationships with nonprofits responding to disasters before a disaster strikes their community. Preparedness helps reduce the time it takes to rebuild communities after a disaster. This includes strengthening the nonprofit infrastructure to handle the additional stresses a disaster poses.
Check out the full Measuring the State of Disaster Philanthropy 2023 infographic to learn more.

Tanya Gulliver-Garcia
Director, Educational Impact