Measuring the Impact of a Natural Disaster
We live in a world that increasingly demands more and better metrics. How often do you ask how many calories are in the sandwich you’re thinking of eating? Or listen to a salesmen tell you how many miles per gallon your new car will get? Or ask a nonprofit organization to report on how many […]
We live in a world that increasingly demands more and better metrics. How often do you ask how many calories are in the sandwich you’re thinking of eating? Or listen to a salesmen tell you how many miles per gallon your new car will get? Or ask a nonprofit organization to report on how many meals they served at a homeless shelter last night and the impact of this effort? We now chant the mantra of Peter Drucker: “If you can’t measure it you can’t manage it.”
So how do you measure a natural disaster?
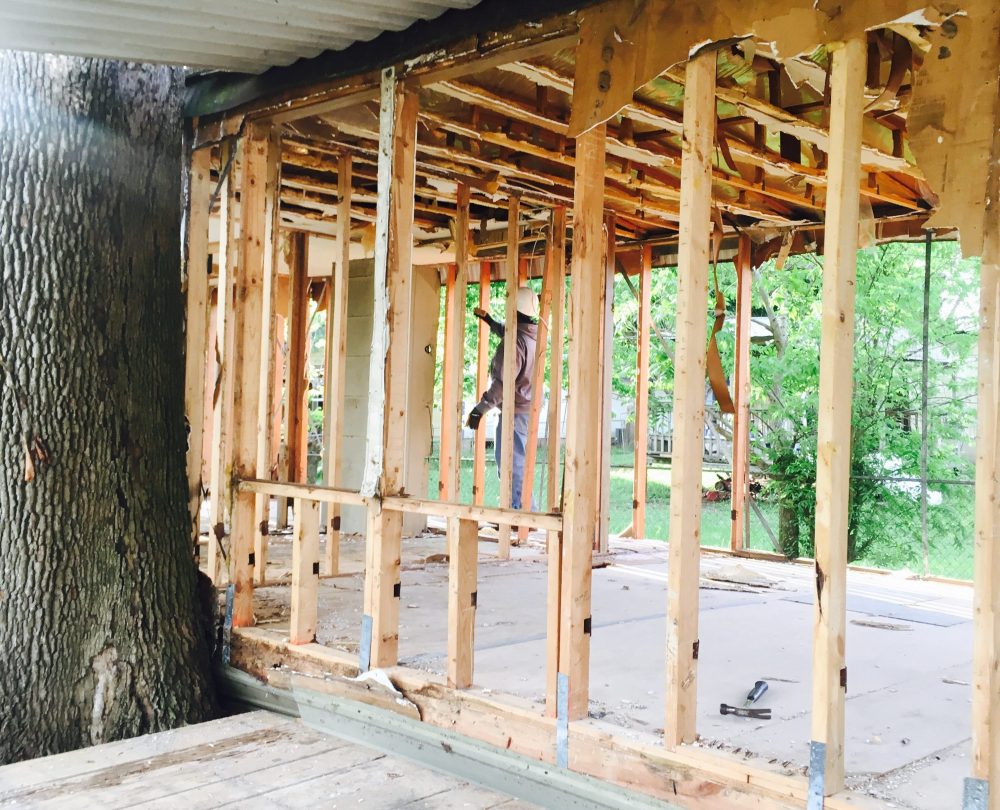
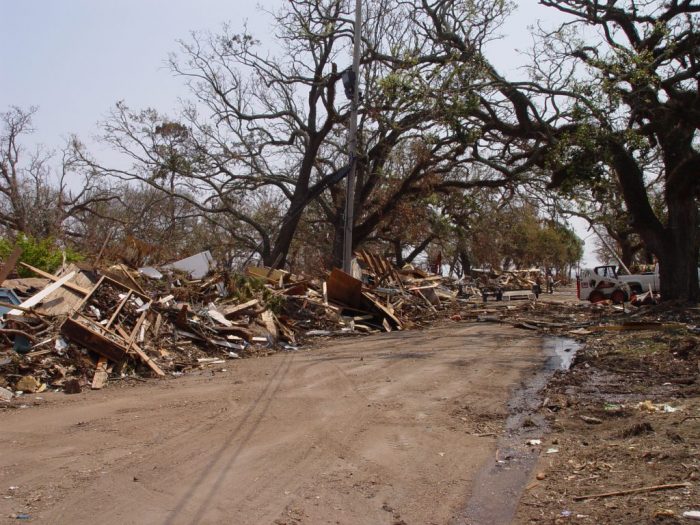
Sometimes a picture, is worth a thousand words. Look at pictures from Typhoon Haiyan, Superstorm Sandy and the tornado in Moore, Oklahoma. What do you need to measure? The utter destruction.
 But the public and the media want more – we need numbers. The National Climatic Data Center (NCDC) calls itself the “Nation’s Scorekeeper” in terms of addressing severe weather/climate events in their historical perspective. It reported 7 disasters in 2013 where there was more than $1 billion dollars in damage. It’s a surprisingly large number and reminds us that all kinds of weather related issues can cause enormous economic destruction – not just the massive hurricanes and tornadoes that make the nightly news.
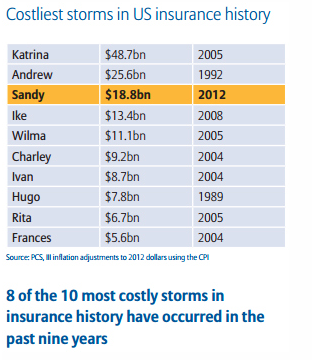
Insurance companies have picked up on this need for more numbers and now issue frequent reports on the dollar cost of a storm. Here’s a chart from the Insurance Journal that was prepared by Allianz Global Corporate and Speciality that reports on the costliest storms solely from the perspective of the US insurance industry.
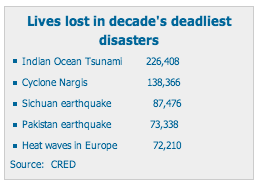
But there’s another way to think about disasters – the number of people killed. The Centre for Research on Epidemiology of Disasters (CRED) keeps track of the number of people that have been killed by disasters. This table looks at years 2000-2009 which was prior to the devastating 2010 earthquake in Haiti that took the lives of 112,000 people.
To get a better understanding of the patterns of deaths caused by disaster, take a look at this chart from CRED of all deaths and those affected by natural disasters by 100,000 inhabitants from 1974 -2003.
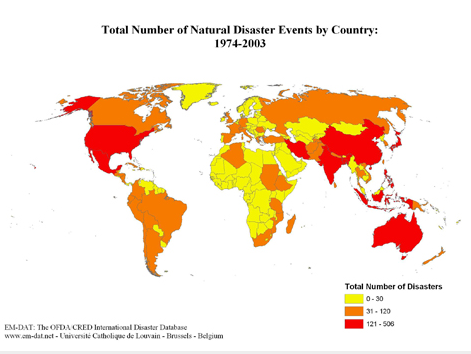
Notice something?
The vast majority of deaths occurred in poor countries with high population density. In fact there seems to be a direct inverse relationship between the number of deaths and the value of property losses. In most developed nations, we’ve seen huge increases in property value. Think about the cost of the house your parents purchased versus what you had to pay for your last house. Everything costs more. So it seems logical that the amount of property value damaged or destroyed would be increasing from year to year. Yes, the number of disasters may be increasing across the world, but deaths are now remarkably low in the United States given the number of natural disasters except in unique instances like Katrina and Sandy. Wealthy countries are better prepared for disasters and better able to bounce back after a disaster than less developed countries.
Next time you hear about a disaster, remember that it is likely to be the poor and vulnerable living in the poorest countries that will be affected the most. And that’s a metric that may be the most important one of all.
Oh and as for that quote about Drucker and measurement? According to the Drucker Institute, he never said it! What he did say is “Your first role . . . is the personal one. It is the relationship with people, the development of mutual confidence, the identification of people, the creation of a community. This is something only you can do. It cannot be measured or easily defined. But it is not only a key function. It is one only you can perform.”

Robert G. Ottenhoff
More like this