How Black History Has Influenced Disaster Planning
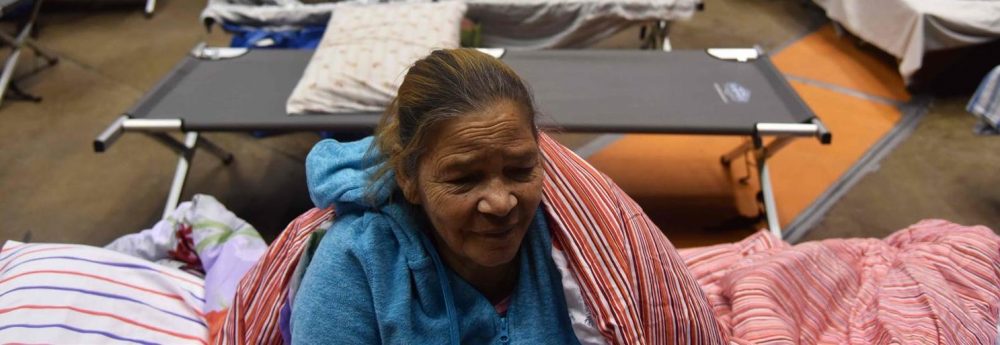
Today, decades after the end of legal limits on their mobility, too many African-Americans and other highly vulnerable populations are place-bound; concentrated in disaster-prone areas without the resources to move out of harm’s way. Those who study disasters in the U.S. have known for decades that some suffer disproportionately due to the impacts of disasters. […]
Today, decades after the end of legal limits on their mobility, too many African-Americans and other highly vulnerable populations are place-bound; concentrated in disaster-prone areas without the resources to move out of harm’s way.
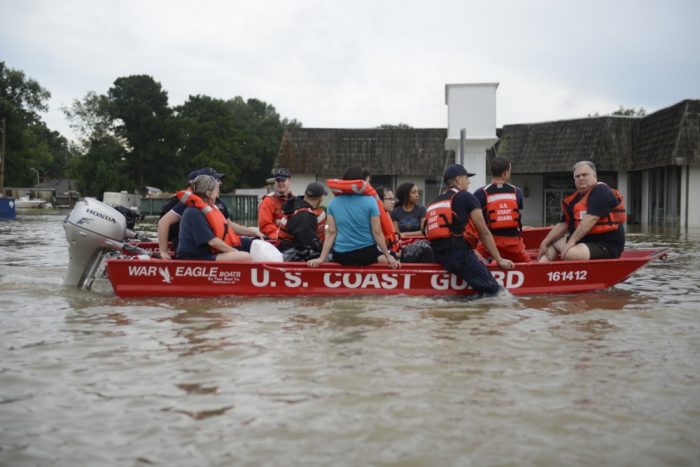
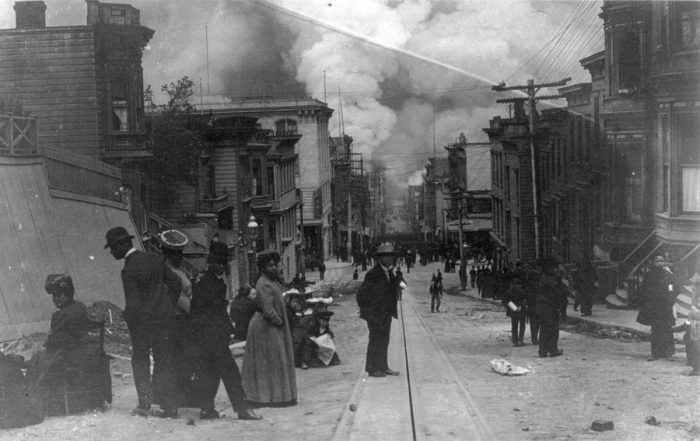
Those who study disasters in the U.S. have known for decades that some suffer disproportionately due to the impacts of disasters. Disasters don’t discriminate of course, but the vestiges of historic discrimination in the U.S. have consigned many African-Americans in particular, to living in high risk flood plains and/or substandard housing less able to withstand the extreme forces of a tornado or hurricane. Further, atrocities African-Americans encountered while trying to survive and recover from disasters have been well documented over the course of recorded U.S. disaster history – from the San Francisco Earthquake (1906), to the Great Mississippi Flood (1927), and Hurricanes Floyd (1999) and Katrina (2005). Today, decades after the end of legal limits on their mobility, too many African-Americans and other highly vulnerable populations are place-bound; concentrated in disaster-prone areas without the resources to move out of harm’s way.
Given what we know from research and experience about the disproportionate burden of disasters, professional disaster planners must account for the conditions, concerns and capacities of the most vulnerable in local disaster plans. However, strategies for increasing the extent to which marginalized populations are aware of and prepared for disasters are still not widely understood among disaster planners. For those interested in learning more, we suggest they start by mapping the “hotspots” of vulnerability.
Vulnerability hotspots are not just sections of communities with concentrations of people of color. Instead, hotspots are the intersections of populations exposed to hazards and with physical and/or social limitations that exacerbate the impact of a disaster. Further, mapping these community indicators can reveal patterns and levels of vulnerability that may not be recognized otherwise.
Mapping Hazard Exposure
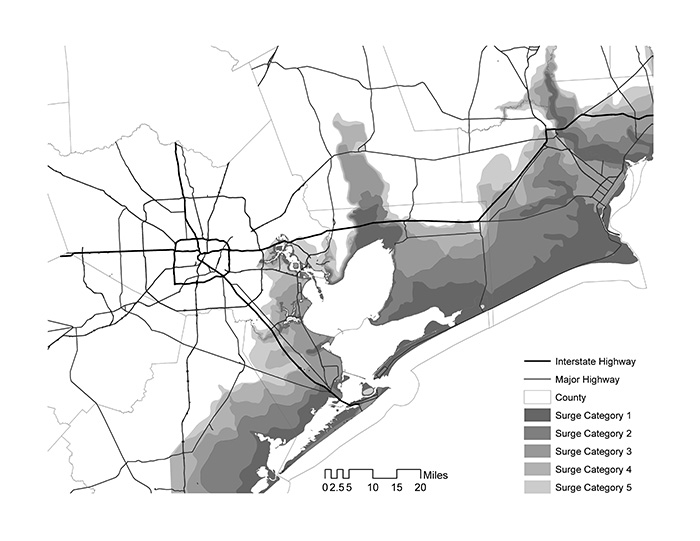
Most hazards are predictable, and many can be depicted geographically. Some common hazards to map include, floodplains, wind risk, fire risk, surge zones, hazardous material sites, and sea level rise (Figure 1), and there are a number of resources available to obtain these data like National Oceanic and Atmospheric Administration, the Intergovernmental Panel on Climate Change, and the Environmental Protection Agency.
Mapping Physical Vulnerability
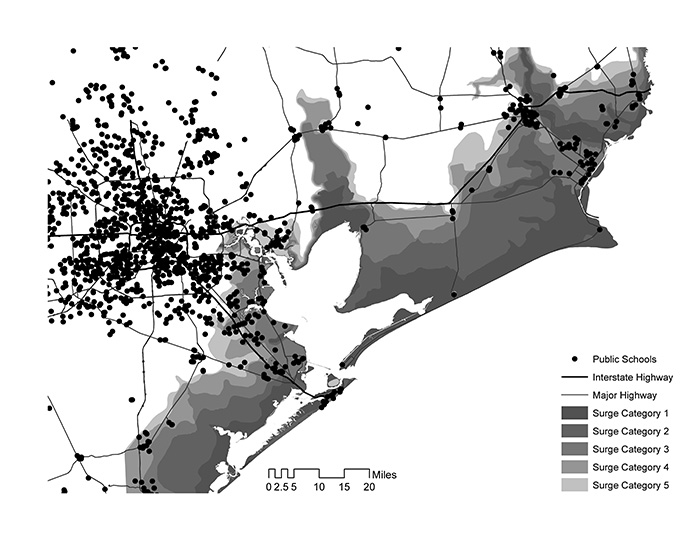
Once you have mapped hazard exposures, you can identify the elements in the built environment that are critical during or in the aftermath of a disaster. Maps should indicate roads designated as evacuation routes, as well as the location of schools, fire stations, police stations, and hospitals for starters. Figure 2 above is an example of a basic map of physical vulnerability. More detailed maps might include critical components of the electrical grid or telecommunications infrastructure exposed to hazards. Another consideration is historically significant and cultural assets in a community. Also think about an inventory of the large economic drivers, key institutions, industries or major employers critical for business recovery that need to be protected.
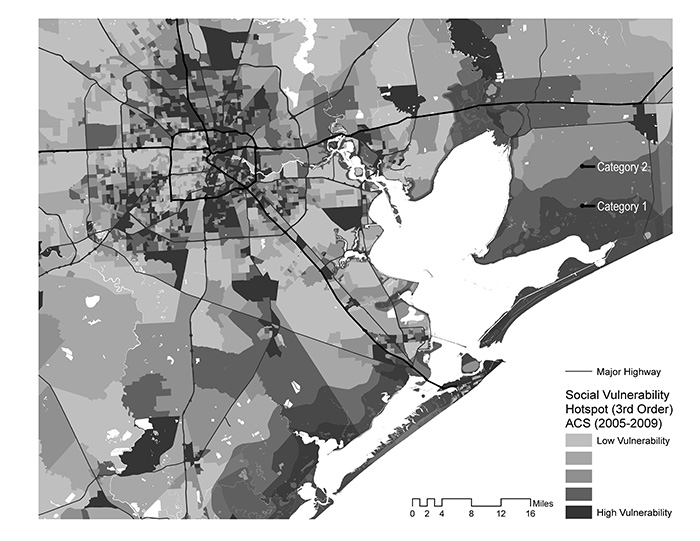
Mapping Social Vulnerability
This step calls for mapping areas in the community where people may have a more difficult time preparing for, responding to, and recovering from a disaster, or social vulnerability (Figure 3). Indicate the areas in your community with higher levels of single parent households and households with dependents for example, as these populations will likely have child-care needs during and after an event. Also, consider mapping groups with disabilities or without vehicles. These groups are less likely to comply with evacuation orders without help.
Once socially vulnerable populations are mapped you can overlay or combine maps of all three community indicators to see where they intersect. These intersections or hotspots of vulnerability can help planners make strategic choices about the allocation of resources before, during and after disasters that ensure optimum efficiency and effectiveness.
The experiences of African-Americans in the midst of the worst disasters in American history have taught us that exposure to and the impacts of disasters are not equally distributed. Today and going forward, these lessons inform the work of disaster planners who care about equity in disaster preparedness, response and recovery.
Note: All images are from the authors’ book, Planning for Community Resilience.

John T. Cooper, Jr., PhD.

Jaimie Hicks Masterson, AICP
More like this
Where will we go from here?