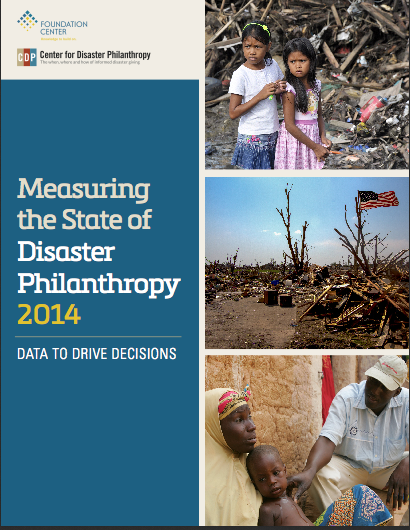
 We at CDP recognized the need for year over year data on how funders direct their resources to disasters. Which disasters are funded, by whom, to which organizations, for what purpose, and with what goal? The beginning of an answer lies in our just released report – Measuring the State of Disaster Philanthropy 2014: Data to Drive Decisions.
The report, the result of a partnership between The Center for Disaster Philanthropy and Foundation Center, is the most comprehensive analysis on disaster philanthropy to date. As aptly stated in the key findings section of the report, it “provides a snapshot of funding for disasters by the largest U.S. foundations.” Focused on 2012 data, this report is designed to establish baseline data and to serves as the base for a longer-term effort to collect and aggregate data from the philanthropic community. Subsequent reports will provide insights into more current and comprehensive trends on disaster giving. Key findings from the report include the following:
- In 2012, 234 foundations made 884 grants totaling $111 million for disasters. The majority of this funding was for natural disasters (58 percent). Almost half was directed to response and relief efforts (46 percent).
- About three out of five grant dollars (62 percent) addressed human service needs related to disasters.
- The majority of grant dollars targeted disasters in North America (62 percent). Countries in Asia received 16 percent and countries in Africa received 13 percent.
- Giving is often influenced by media coverage, which tends to focus on acute and telegenic disasters. Complex humanitarian emergencies, famines, and other disasters that are considered “slow-onset” tend to receive less media attention and less funding.
- Disasters receiving the most television news coverage in the past 26 years were the attacks of September 11, 2001, the Oklahoma City federal building bombing, and Hurricane Katrina.
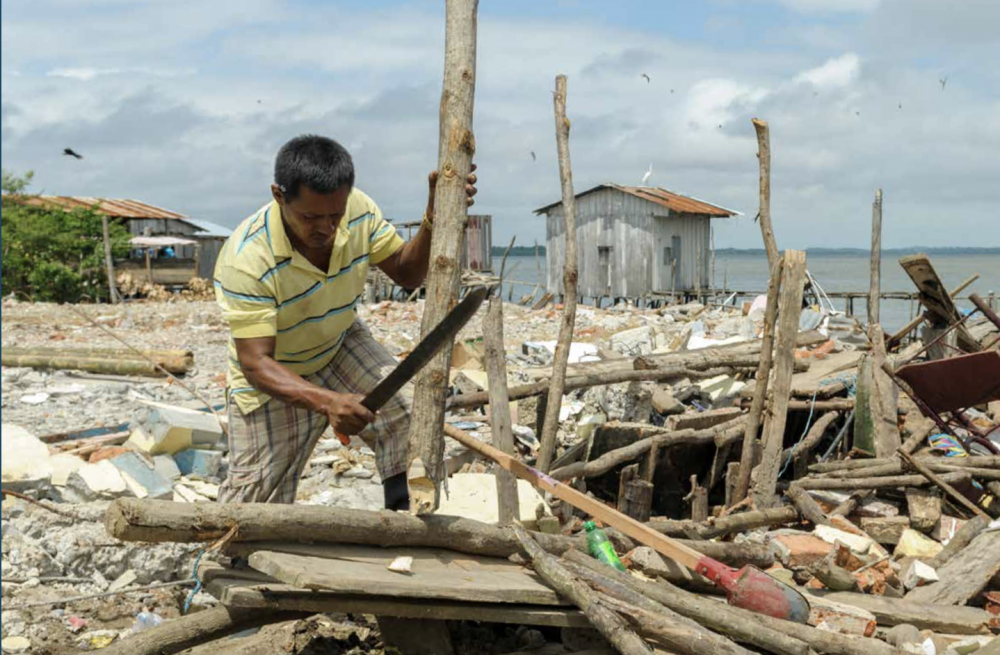
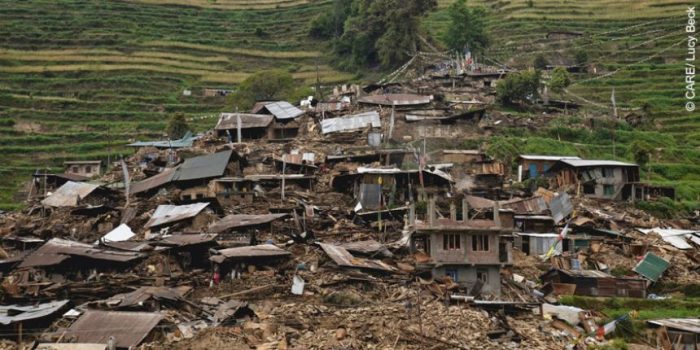
- Lessons learned from past disasters highlight the need for funding beyond immediate relief. Building community resiliency and preparedness can contribute substantially to mitigating the impact of disasters. In addition, long-term recovery and reconstruction efforts are crucial, particularly after media attention and relief funding have dwindled.
With the knowledge we are gaining from this year’s report, and will learn from future updates, we have the power to truly change our collective behavior – directing more funds in more strategic ways to ensure the needs of disaster-affected communities both domestically and globally are well taken care of.
The release of this report is only step one of our effort. We will soon begin to build a space on our website to house the data that we collect, we will be launching a data gathering network to facilitate the capture of real time disaster grantmaking, and we will continue to utilize the expert minds of our advisory committee and technical working group.


